![[Compaq]](../../images/compaq.gif)
![[Go to the documentation home page]](../../images/buttons/bn_site_home.gif)
![[How to order documentation]](../../images/buttons/bn_order_docs.gif)
![[Help on this site]](../../images/buttons/bn_site_help.gif)
![[How to contact us]](../../images/buttons/bn_comments.gif)
![[OpenVMS documentation]](../../images/ovmsdoc_sec_head.gif)
| Document revision date: 30 March 2001 | |
![[Compaq]](../../images/compaq.gif) |
![[Go to the documentation home page]](../../images/buttons/bn_site_home.gif)
![[How to order documentation]](../../images/buttons/bn_order_docs.gif)
![[Help on this site]](../../images/buttons/bn_site_help.gif)
![[How to contact us]](../../images/buttons/bn_comments.gif)
|
![[OpenVMS documentation]](../../images/ovmsdoc_sec_head.gif)
|
|
| Previous | Contents | Index |
Table B-1 provides a quick reference to the MONITOR data items that you will probably need to check most often in evaluating your resources.
| Item | Class | Description1 |
|---|---|---|
|
Compute Queue
(COM + COMO) |
STATES | Good measure of CPU responsiveness in most environments. Typically, the larger the compute queue, the longer the response time. |
| Idle Time | MODES | Good measure of available CPU cycles, but only when processes are not unduly blocked because of insufficient memory or an overloaded disk I/O subsystem. |
| Inswap Rate | IO | Rate used to detect memory management problems. Should be as low as possible, no greater than 1 per second. |
|
Interrupt State Time
+ Kernel Mode Time |
MODES | Time representing service performed by the system. Normally, should not exceed 40% in most environments. |
|
MP Synchronization
Time |
MODES | Time spent by a processor waiting to acquire a spin lock in a multiprocessing system. A value greater than 8% might indicate moderate-to-high levels of paging, I/O, or locking activity. |
| Executive Mode Time | MODES | Time representing service performed by RMS and some database products. Its value will depend on how much you use these facilities. |
| Page Fault Rate | PAGE | Overall page fault rate (excluding system faults). Paging might demand further attention when it exceeds 600 faults per second. |
| Page Read I/O Rate | PAGE | The hard fault rate. Should be kept below 10% of overall rate for efficient use of secondary page cache. |
| System Fault Rate | PAGE | Rate should be kept to minimum, proportional to your CPU performance. |
|
Response Time (ms)
(computed) |
DISK | Expected value is 25--40 milliseconds for RA-series disks with no contention and small transfers. Individual disks will exceed that value by an amount dependent on the level of contention and the average data transfer size. |
| I/O Operation Rate | DISK |
Overall I/O operation rate. The following are normal load ranges for
RA-series disks in a typical timesharing environment, where the vast
majority of data transfers are small:
#1 to 8---lightly loaded |
|
Page Read I/O Rate
+ Page Write I/O Rate + Inswap Rate (times 2) + Disk Read Rate + Disk Write Rate |
PAGE
PAGE IO FCP FCP |
System I/O operation rate. The sum of these items represents the portion of the overall rate initiated directly by the system. |
| Cache Hit Percentages |
FILE_
SYSTEM_ CACHE |
XQP cache hit percentages should be kept as high as possible, no lower than 75% for the active caches. |
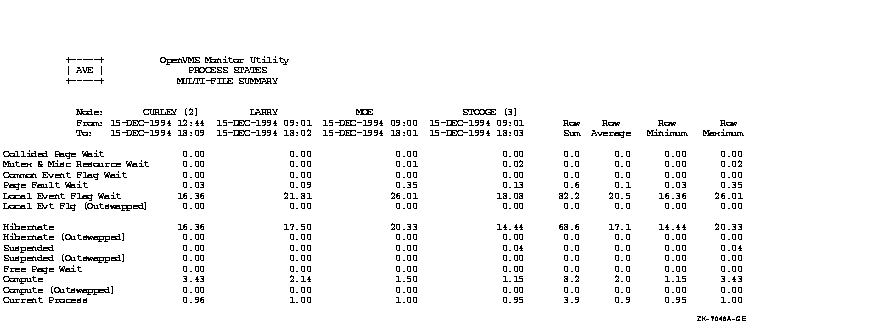
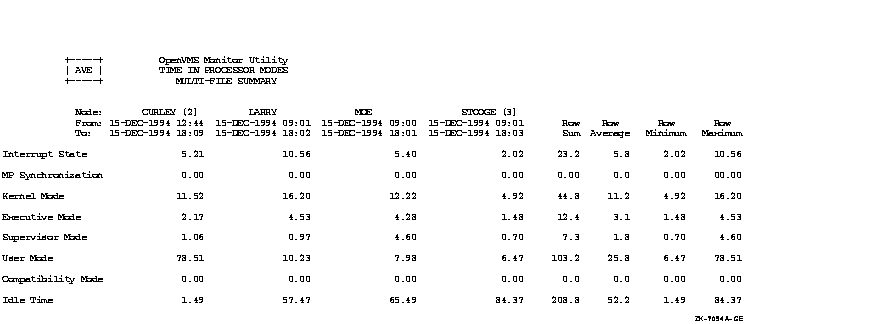
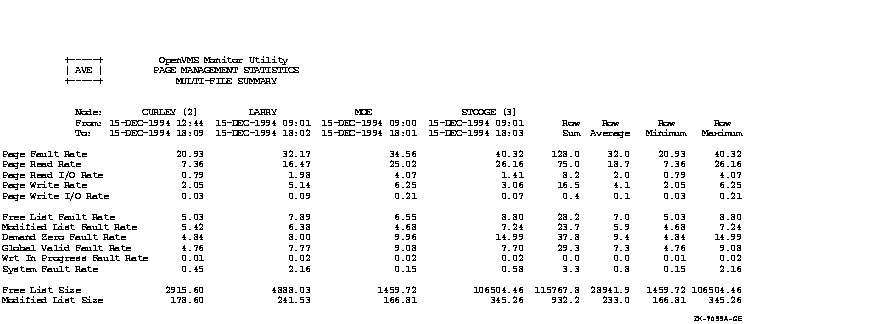
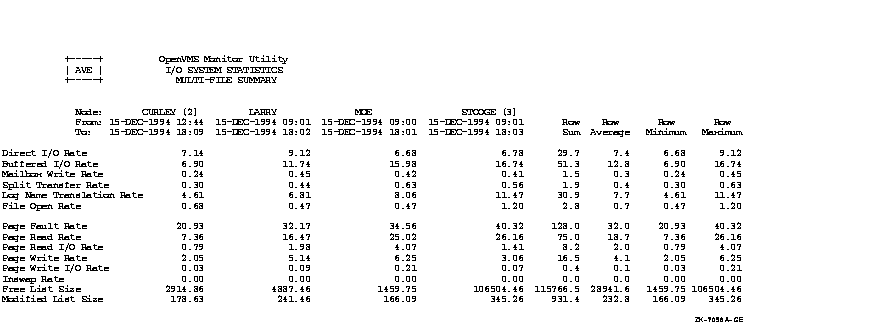
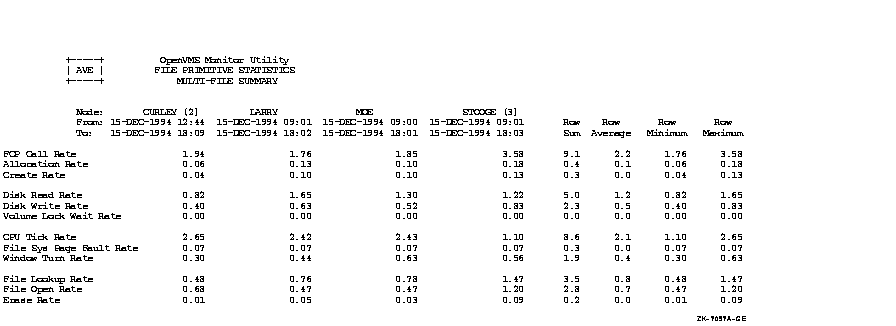
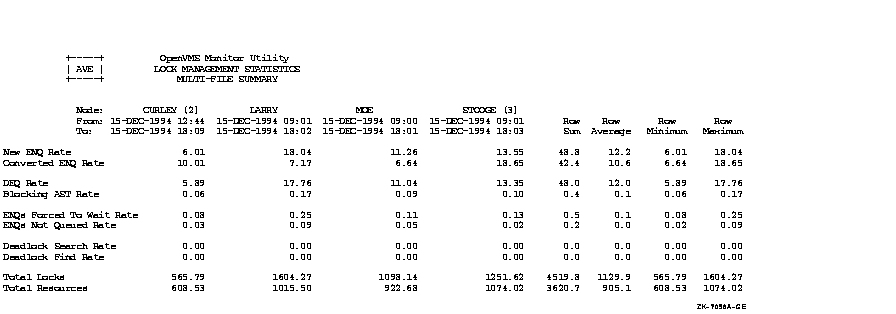
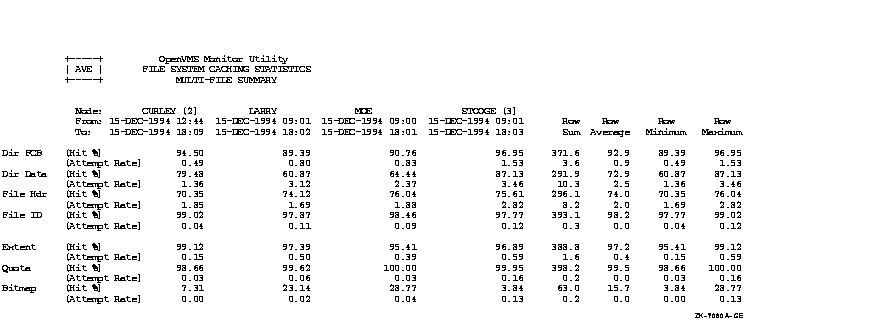
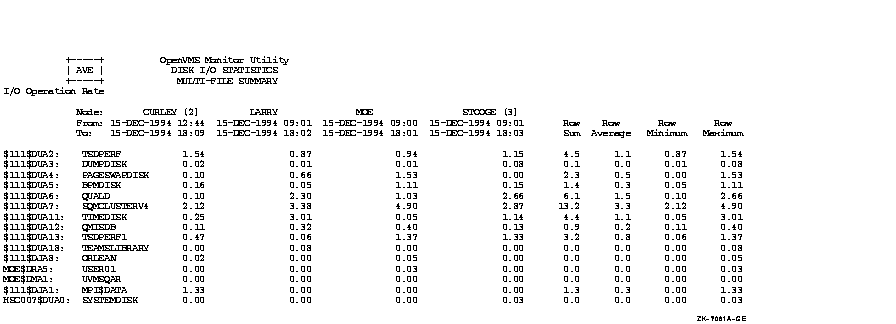
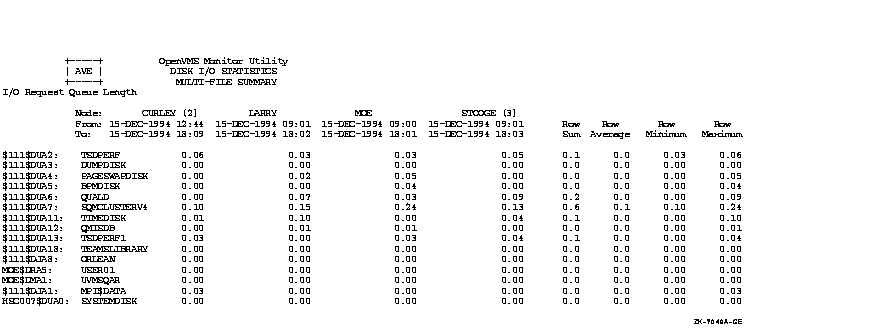
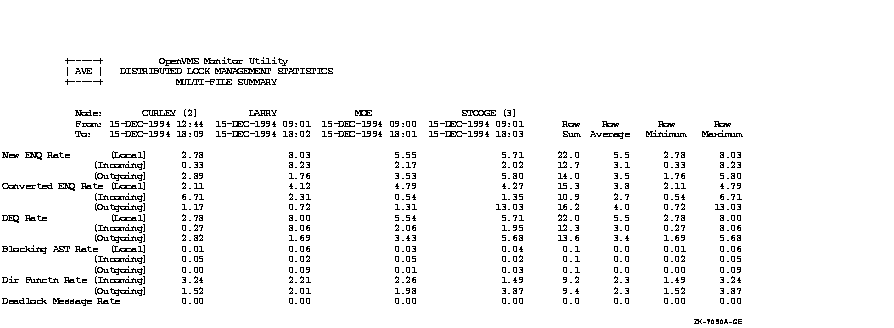
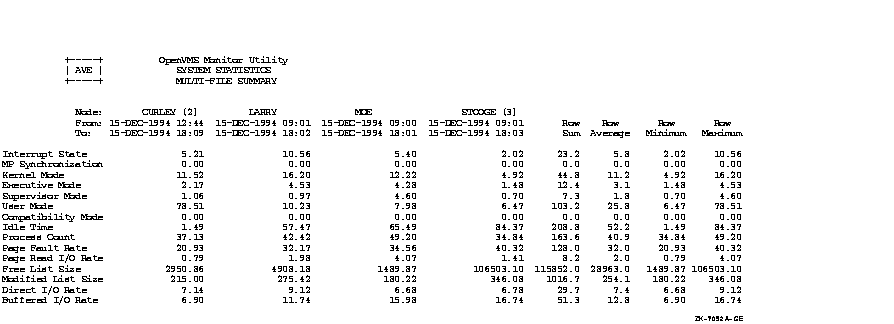
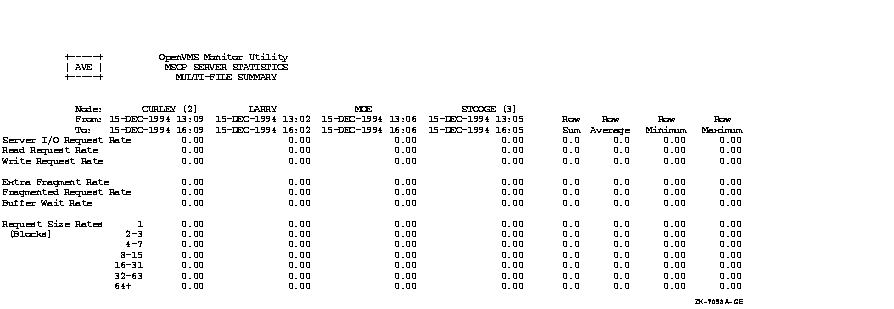
Figure C-1, an OpenVMS Cluster prime-time multifile summary report, provides an extended context for the data items in Table B-1.
Figure C-1 Prime-Time OpenVMS Cluster Multifile Summary Report


This appendix provides performance information specific to Files--11
ODS-1 (On-Disk Structure Level 1) disks.
D.1 Disk or Tape Operation Problems (Direct I/O)
You may encounter the following disk and tape problems:
Sometimes you may detect a lower direct I/O rate for a device than you would expect. This condition implies that either very large data transfers are not completing rapidly (probably in conjunction with a memory limitation centered around paging and swapping problems) or that some other devices are blocking the disks or tapes.
If you have already investigated the memory limitation and taken all possible steps to alleviate it (which is the recommended step before investigating an I/O problem), then you should try to determine the source of the blockage.
A blockage in the I/O subsystem suggests that I/O requests are queueing up because of a bottleneck. For disks, you can determine that this condition is present with the MONITOR DISK/ITEM=QUEUE_LENGTH command.
When you find a queue on a particular device, you cannot necessarily conclude that the device is the bottleneck. At this point, simply note all devices with queues for later reference. (You will need to determine which processes are issuing the I/O operations for the devices with queues.)
As the next step, you should rule out the possibility of a lockout
situation induced by an ancillary control process (ACP). (Note that
this condition arises only if you have ODS-1 disks.) If the system
attempts to use a single ACP for both slow and fast devices, I/O
blockages can occur when the ACP attempts to service a slow device.
This situation can occur only if you have mounted a device with the
/PROCESSOR qualifier.
D.1.2 Explicit QIO Usage Is Too High
Next, you need to determine if any process using a device is executing
a program that employs explicit specification of QIOs rather than RMS.
If you enter the MONITOR PROCESSES/TOPDIO command, you can identify the
user processes worth investigating. It is possible that the
user-written program is not designed properly. It may be necessary to
enable virtual I/O caching. I/O requests using the function modifier
IO$_READVBLK can read from the virtual I/O cache.
D.2 Adjust Working Set Characteristics: Establish Values for Ancillary Control Processes
An ancillary control process (ACP) acts as an interface between the user software and the I/O driver. The ACP supplements functions performed by the driver such as file and directory management.
Before studying the considerations for adjusting working set sizes for processes in general, consider the special case of the ACP. (Note that you will be using an ACP for disks only if you have ODS-1 disks.) The default size of the working set (and in this case, the working set quota, too) for all ACPs is determined by the system parameter ACP_WORKSET. If ACP_WORKSET is zero, the system calculates the working set size for you. If you want to provide a specific value for the working set default, you just specify the desired size in pages with AUTOGEN. (If your system uses multiple ACPs, remember that ACP_WORKSET is a systemwide parameter; any value you choose must apply equally well to all ACPs.)
If you decide to reduce ACP_WORKSET (with the intent of inducing modest paging in the ACP), use the SHOW SYSTEM command to determine how much physical memory the ACP currently uses. Set the system parameter ACP_WORKSET to a value that is 90 percent of the ACP's current usage. However, to make the change effective for all ACPs on the system, not just the ones created after the change, you must reboot the system.
Once you reduce the size of ACP_WORKSET, observe the process with the
SHOW SYSTEM command to verify that the paging you have induced in the
ACP process is moderate. Your goal should be to keep the total number
of page faults for the ACP below 20 percent of the direct I/O count for
the ACP.
D.3 Enable Swapping for Disk ACPs
If a disk ACP has been set up so that it will not be outswapped, and
you determine that the system would perform better if it were, you must
use AUTOGEN to modify the system parameter ACP_SWAPFLGS and then reboot
the system. The OpenVMS System Management Utilities Reference Manual describes how to specify the flag value
for ACP_SWAPFLGS that will permit swapping of the ACP.
D.4 Remove Blockage Due to ACP
Of the four sources of bottlenecks, the ACP lockout problem is the easiest to detect and solve. Moreover, it responds to software tuning.
Note that you will be using an ACP for disks only if you have ODS-1 disks.
The solution for an ACP lockout caused by a slow disk sharing an ACP with one or more fast disks requires that you dismount the slow device with the DCL command DISMOUNT, then enter the DCL command MOUNT/PROCESSOR=UNIQUE to assign a private ACP to the slow device. However, be aware that each ACP has its own working set and caches. Thus, creating multiple ACPs requires the use of additional memory.
Also, there are situations that might share some of the symptoms of an
ACP lockout that will not respond to adding an ACP. For example, when
substantial I/O activity is directed to the same device so that the
activity in effect saturates the device, adding an ACP for another
device without taking steps to redirect or redistribute some of the I/O
activity to the other device yields no improvement.
D.4.1 Blockage Due to a Device, Controller, or Bus
When you are confronted with the situation where users are blocked by a
bottleneck on a device, a controller, or a bus, first evaluate whether
you can take any action that will make less demand on the bottleneck
point.
D.4.2 Reduce Demand on the Device That Is the Bottleneck
If the bottleneck is a particular device, you can try any of the following suggestions, as appropriate. The suggestions begin with areas that are of interest from a tuning standpoint and progress to application design areas.
One of the first things you should determine is whether the problem device is used for paging or swapping files and if this activity is contributing to the I/O limitation. If so, you need to consider ways to shift the I/O demand. Possibilities include moving either the swapping or paging file (or both, if appropriate) to another disk. However, if the bottleneck device is the system disk, you cannot move the entire paging file to another disk; a minimum paging file is required on the system disk. See the discussion of AUTOGEN in the OpenVMS System Manager's Manual, Volume 2: Tuning, Monitoring, and Complex Systems for additional information and suggestions.
Another way to reduce demand on a disk device is to redistribute the directories over one or more additional disks, if possible. You can allocate memory to multiple ACPs (ODS--1 only) to permit redistributing some of the disk activity to other disks. Section 12.4 discusses RMS caching and some of the implications of using RMS to alleviate the I/O on the device. Also consider that, if the disks have been in use for some time, the files may be fragmented. You should run the Backup utility to eliminate the fragmentation. (See the OpenVMS System Manager's Manual, Volume 1: Essentials.) If this approach is highly successful, institute a more regular policy for running backups of the disks.
As a next step, try to schedule work that heavily accesses the device
over a wider span of time or with a different mix of jobs so that the
demand on the device is substantially reduced at peak times. Moving
files to other existing devices to achieve a more even distribution of
the demand on all the devices is one possible method. Modifications to
the applications may also help distribute demand over several devices.
Greater changes may be necessary if the file organization is not
optimal for the application; for example, if the application employs a
sequential disk file organization when an indexed sequential
organization would be preferable.
D.4.3 Reduce Demand on the Controller That Is the Bottleneck
When a controller is the bottleneck, balance the load by moving demand
to another controller. If all controllers are overloaded, acquire
additional hardware.
D.4.4 Reduce Demand on the Bus That Is the Bottleneck
Another suggestion is to place controllers on separate buses. Again, you want to segregate the slower speed units from the faster units.
When a bus becomes the bottleneck, the only solution is to acquire another bus so that some of the load can be redistributed over both buses.
Adjustment period: The time from the start of quantum
right after an adjustment occurs until the next quantum after the time
specified by the AWSTIME parameter elapses as shown in the following
equation:
adjustment period = QUANTUM + AWSTIME
Ancillary control process (ACP): An interface between
user software and the I/O driver. The ACP supplements functions
performed by the driver such as file and directory management.
AUTOGEN: An OpenVMS command procedure that establishes
initial values for all the configuration-dependent system parameters so
that they match your particular configuration.
Automatic working set adjustment (AWSA): A system
where processes can acquire additional working set space (physical
memory) under control of the operating system.
Balance set: The sum of all working sets currently in
physical memory.
Binding resource (bottleneck): An overcommitted
resource that causes the others to be blocked or burdened with overhead
operations.
Blocked process: A process waiting for an event to
occur (a specific semaphore signaled) before continuing execution.
Buffered I/O: An input/output operation, such as
terminal or mailbox I/O, in which an intermediate buffer from the
system buffer pool is used instead of a process-specified buffer.
Cache: A block of memory used to minimize the physical
transfer of data between physical memory and secondary storage devices.
Channel: There are two types of channel: physical and logical.
A physical channel is the path from a device such as a disk through a controller, across buses, to memory.
A logical channel is a software construct that connects a user process
to a physical device. A user process uses the system service SYS$ASSIGN
to request that the operating system assign a logical channel to a
physical channel, which permits the process to communicate with that
device.
Compute-bound: Slow system response due to a large
number of computations.
Context switching: Interrupting the activity in
progress and switching to another activity. Context switching occurs as
one process after another is scheduled for execution.
Direct I/O: An input/output operation in which the
system locks the pages containing the associated buffer in physical
memory for the duration of the I/O operation. The I/O transfer takes
place directly from the process buffer.
Disk thrashing: Excessive reading and writing to disk.
Dynamic parameter: A parameter that can be changed
while the system is running by changing the active value in memory.
Hard paging: Paging directly from disk.
High-water marking: A security feature that guarantees
that users cannot read data they have not written. It is implemented by
erasing the previous contents of the disk blocks allocated every time a
file is created or extended.
Image: A set of procedures and data bound together by
the linker.
I/O operation: The process of requesting a transfer of
data from a peripheral device to memory (or vice versa), the actual
transfer of the data, and the processing and overlaying activity to
make both of those events happen.
Locality of reference: A characteristic of a program
that indicates how close or far apart the references to locations in
virtual memory are over time. A program with a high degree of locality
does not refer to many widely scattered virtual addresses in a short
period of time.
Multiblock count: The number of blocks that RMS moves
in and out of the I/O buffer during each I/O operation for a sequential
file.
Multibuffer count: The number of buffers RMS uses to
perform an I/O operation.
MWAIT: A process in the miscellaneous resource wait
(MWAIT) state is blocked either by a miscellaneous resource wait or a
mutual exclusion semaphore (MUTEX).
Nonpaged pool area: A portion of physical memory
permanently allocated to the system for the storage of data structures
and device drivers.
Page: On Alpha, either an 8 KB, 16 KB, 32 KB, or 64 KB segment of virtual address space.
On VAX, a 512-byte segment of virtual address space.
Pagelet: On Alpha, a 512-byte unit of memory. One
Alpha pagelet is the same size as one VAX page.
Paging: The exchange of pages between physical memory
and secondary storage.
Performance management: The process of optimizing your hardware and software resources for the current work load. This involves performing the following tasks:
Process: The basic entity that is scheduled by the
system. It provides the context in which an image executes.
Quantum: The amount of time available for a process to
perform its work.
RAM disk: A virtual disk device that resides in
physical memory or in a physically separate peripheral device. The
operating system can read from and write to the RAM disk using standard
disk I/O operations.
Scheduler: A portion of the executive that controls
both when and how long a process executes.
Semaphore: A synchronization tool that is used to
control exclusive access to a shared database or other resource. It
ensures that only one process at a time is within the critical region
of code that accesses the resource.
Soft paging: Paging from the page cache in main memory.
Spin lock: A mechanism that guarantees the
synchronization of processors in their manipulation of operating system
databases.
Swapper: A portion of the executive that schedules
physical memory. It keeps track of the pages in both physical memory
and on the disk paging and swapping files so it can ensure that each
process has a steady supply of pages for each job.
Swapping: The partial or total removal of a process's
working set from memory.
System resource: A hardware or software component or subsystem under the direct control of the operating system, which is responsible for data computation or storage. The following subsystems are system resources:
System working set: An area of physical memory
reserved to satisfy page faults of virtual addresses in system space.
Throughput rate: The amount of work accomplished in a
given time interval, for example, 100 transactions per second.
Time slicing: Rotating a period of time defined by the
system parameter QUANTUM among processes.
Tuning: The process of altering various system values
to obtain the optimum overall performance possible from any
given configuration and work load.
Voluntary decrementing: Automatically decreasing the
working set size by the amount set by the system parameter WSDEC. For
example, if the page fault rate at the end of a process's adjustment
period is too low compared with PFRATH, then the system approves a
decrease in the working set size of that process by the amount set by
the system parameter WSDEC.
Working set: The total number of a process's pages in
physical memory. It is a subset of the total number of pages allocated
to a process. Also called the primary page cache.
Working set count: The actual number of pages the working set requires. It consists of the process's pages plus any global pages the process uses.
| Index | Contents |
![[Go to the documentation home page]](../../images/buttons/bn_site_home.gif)
![[How to order documentation]](../../images/buttons/bn_order_docs.gif)
![[Help on this site]](../../images/buttons/bn_site_help.gif)
![[How to contact us]](../../images/buttons/bn_comments.gif)
|
| privacy and legal statement | ||
| 6491PRO_016.HTML | ||