![[Compaq]](../../images/compaq.gif)
![[Go to the documentation home page]](../../images/buttons/bn_site_home.gif)
![[How to order documentation]](../../images/buttons/bn_order_docs.gif)
![[Help on this site]](../../images/buttons/bn_site_help.gif)
![[How to contact us]](../../images/buttons/bn_comments.gif)
![[OpenVMS documentation]](../../images/ovmsdoc_sec_head.gif)
| Document revision date: 30 March 2001 | |
![[Compaq]](../../images/compaq.gif) |
![[Go to the documentation home page]](../../images/buttons/bn_site_home.gif)
![[How to order documentation]](../../images/buttons/bn_order_docs.gif)
![[Help on this site]](../../images/buttons/bn_site_help.gif)
![[How to contact us]](../../images/buttons/bn_comments.gif)
|
![[OpenVMS documentation]](../../images/ovmsdoc_sec_head.gif)
|
|
| Previous | Contents | Index |
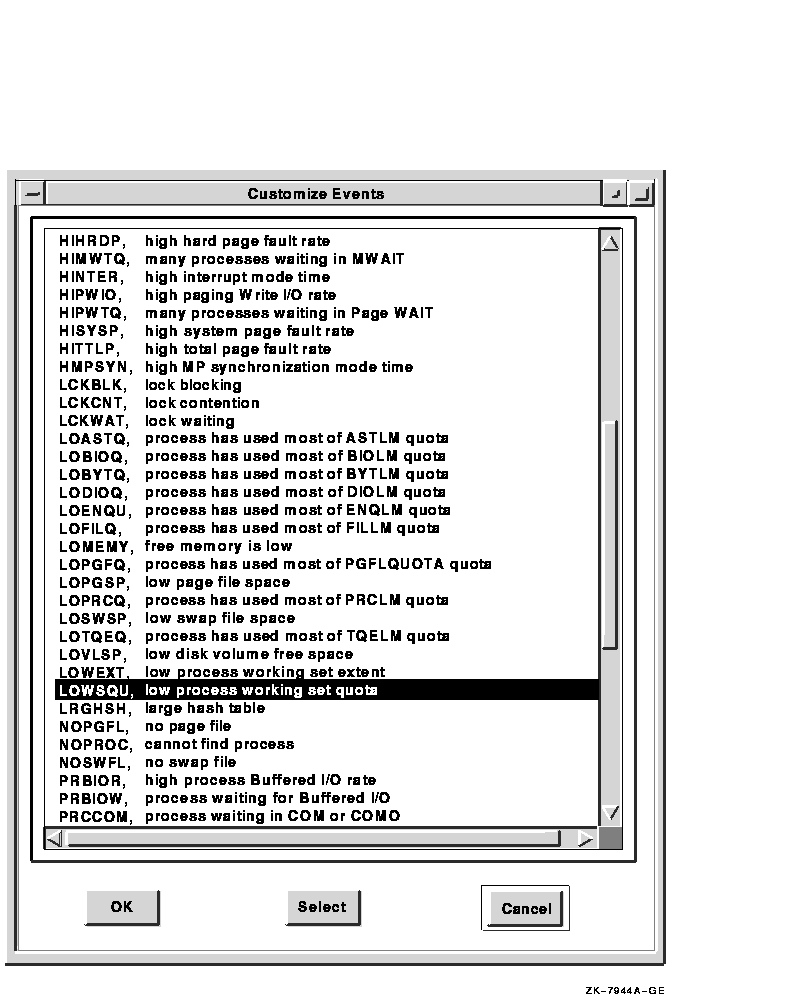
You can define criteria by which specific events are qualified for your attention. For example, you can refine the global filtering by also defining that DSKRWT event (high disk device Rwait count) must pass your specifications before being considered an event worth displaying or logging. To define specific event criteria, perform the following steps:
Figure 5-4 Customize Events Dialog Box

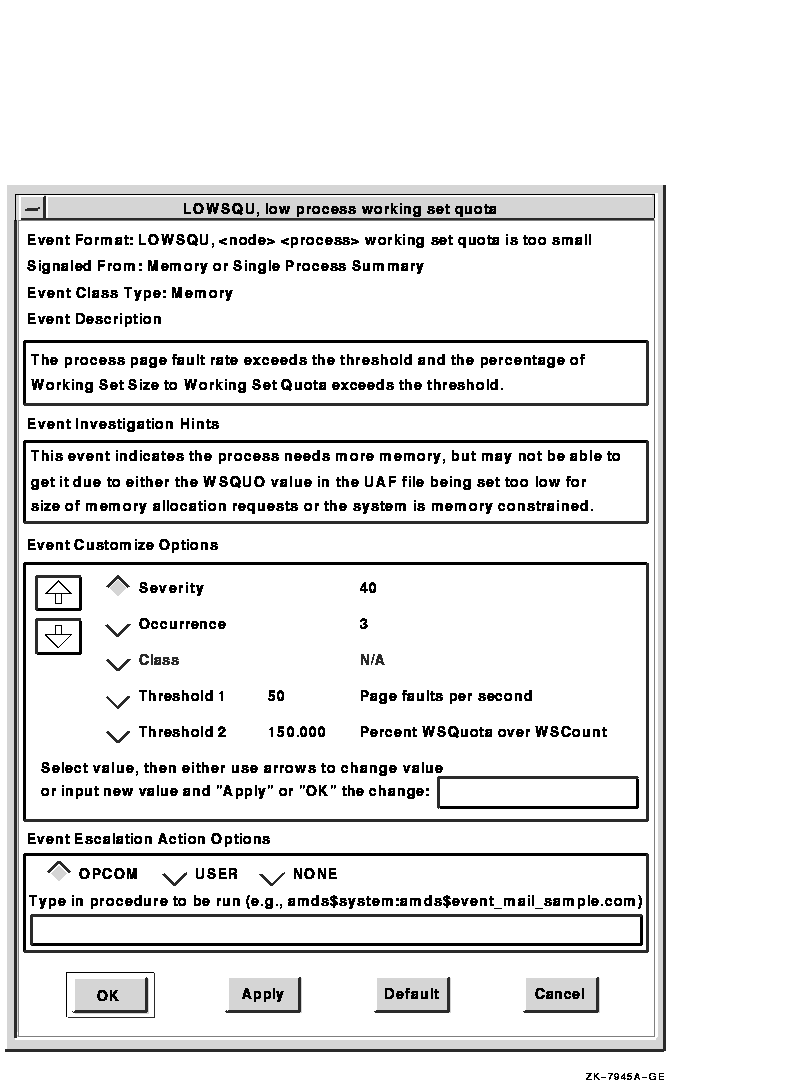
Figure 5-5 LOWSQU Event Customization Window

The following sections describe the event customization options.
Severity is the relative importance of an event. Events with a high severity must also exceed threshold settings before an event can be signaled for display or logging.
Each DECamds event is assigned an occurrence value, that is, the number of consecutive data samples that must exceed the event threshold before the event is signaled. By default, events have low occurrence values. However, you might find that a certain event only indicates a problem when it occurs repeatedly for an extended period. You can change the occurrence value assigned to that event so that DECamds signals it only when necessary.
For example, suppose page fault spikes are common in your environment, and DECamds frequently signals intermittent HITTLP, total page fault rate is high events. You could change the event's occurrence value to 3, so that the total page fault rate must exceed the threshold for three consecutive collection intervals before being signaled to the Event Log.
To avoid displaying insignificant events, you can customize an event so that DECamds signals it only when it continuously occurs.
Automatic Event Investigation (see Section 5.1.2) uses the occurrence value to determine when to further investigate an event. When enabled, the automatic event investigation is activated when the Occurrence count is three times the Occurrence setting value.
You can customize certain events so that the event threshold varies depending on the class of computer system the event occurs on. This feature is particularly useful in environments with many different types and sizes of computers.
By default, DECamds uses only one default threshold for each event, regardless of the type of computer the event occurs on. However, for certain events (in particular, CPU, I/O, and memory usage events) the level at which resource use becomes a problem depends on the size and type of computer. For example, a page fault rate of 100 may be important on a VAXstation 2000 system but not on a VAX 7000 system.
DECamds provides three additional predefined classes for CPU, I/O, and Memory-related events. You can specify threshold values for each class in addition to the default threshold for an event. To specify an additional event threshold for each class, edit the file AMDS$THRESHOLD_DEFS.DAT located in the AMDS$CONFIG directory.
Table 5-3 defines CPU, I/O, and Memory classes.
| Class1 | Description |
|---|---|
| CPU Classes | |
| Class 1 | All VAXft systems, VAXstation/VAXserver 4000, MicroVAX 4000 |
| Class 2 | Higher VUP workstations: VAXstation/VAXserver 3100-M76, MicroVAX 3100-M76, MicroVAX 3100-8*, VAXstation 3100-9*, MicroVAX 3100-9*, VAXstation 4000-9* |
| Class 3 | VAX/VAXserver 6000, 7000, 9000, 10000 |
| Class 4 | All Alpha systems |
| I/O Classes | |
| Class 1 | All VAX systems, VAXft systems, VAXstation/VAXserver 4000, MicroVAX 4000 |
| Class 2 | Higher VUP workstations: VAXstation/VAXserver 3100-M76, MicroVAX 3100-M76, MicroVAX 3100-8*, VAXstation 3100-9*, MicroVAX 3100-9*, VAXstation 4000-9* |
| Class 3 | VAX/VAXserver 6000, 7000, 9000, 10000 |
| Class 4 | All Alpha systems |
| Memory Classes | |
| Class 1 | Systems with less than or equal to 24 MB of memory |
| Class 2 | Systems with more than 24 MB and less than or equal to 64 MB of memory |
| Class 3 | Systems with more than 64 MB of memory |
| Class 4 | All Alpha systems |
You can specify class-based thresholds only for the following events:
HINTER, node interrupt mode time is high
HICOMQ, node many processes waiting for CPU
HMPSYN, node MP synchronization mode time is high
HIPWTQ, node many processes waiting in COLPG, PFW, or FPG
HIMWTQ, node many processes waiting in MWAIT
HIBIOR, node buffered I/O rate is high
HIDIOR, node direct I/O rate is high
HIPWIO, node paging write I/O rate is high
LOMEMY, node free memory is low
HIHRDP, node hard page fault rate is high
HISYSP, node high system page fault rate
HITTLP, node total page fault rate is high
RESPRS, node resource hash table sparse
RESDNS, node resource hash table dense
As an example of setting a class-based threshold, the HITTLP, total page fault rate is high event is a memory-related event, so the thresholds are based on the memory class definitions shown in Table 5-3. The default threshold for this event is 20 page faults per second. A page fault rate of 20 may be important on a VAXstation 2000 system, but it is not important on a VAX 7000 system. To account for this, you can specify the following additional thresholds for the HITTLP, total page fault rate is high event:
| Class | Threshold | Description |
|---|---|---|
| 1 (systems with less than or equal to 64 MB of memory) | 20 | Event is triggered at the default threshold of 20 page faults per second. |
| 2 (systems with 24 MB to 64 MB of memory) | 40 | Event is triggered at 40 page faults per second. |
| 3 (systems with more than 64 MB of memory) | 100 | Event is triggered at 100 page faults per second. |
| 4 (Alpha systems) | 100 | Event is triggered at 100 page faults per second |
Threshold values are compared to an event's description to determine whether an event meets the criteria for display or log. Threshold values are used in conjunction with the occurrence and severity values. Increasing event threshold values can reduce CPU use and improve perceived response time because more instances must occur for the threshold to be crossed, so fewer thresholds are crossed and fewer events are triggered.
Setting a threshold too high could mask a serious problem. |
You can read a description of an event by choosing Customize Events from the Customize menu in the Event Log window, then double-clicking on the event. The Event Customization dialog box displays an Event Description field.
Most events are checked against only one threshold; however, some have dual thresholds, where the event is triggered if either one is true. For example, for the LOVLSP, node disk volume free space is low event, DECamds checks both of the following thresholds:
Events with both high severity and threshold values are signaled to the operator communication manager (OPCOM). For more information about signaling events to OPCOM, see Section 2.3.3. |
Choose Sort Data... from the Customize menu to change the order of the information displayed in a window. A dialog box appears in which you can specify sort criteria. All sort criteria must be met for a process to be displayed.
You can sort data in the following windows:
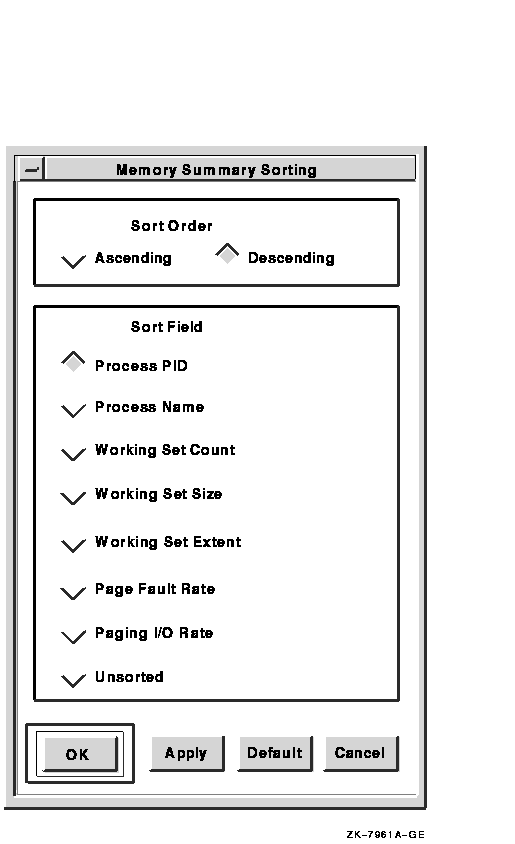
Figure 5-6 shows a sample Memory Summary Sorting dialog box.
Figure 5-6 Memory Summary Sorting Dialog Box

Sorting is based on two variables: the sort order and the sort field. You can choose only one sort criterion for each variable---one for the sort order, and one for the sort field. To sort Memory Summary data to list the processes with the highest page fault rates first, for example perform the following steps:
A collection interval is the time the Data Analyzer waits before requesting more information from Data Provider nodes. Changing the collection interval helps you control the performance of DECamds and its consumption of system resources.
The frequency of polling remote nodes for data (collection intervals) can affect perceived response time. You want to find a balance between collecting data often enough to detect potential resource availability problems before a node or cluster experiences a severe problem, and seldom enough to optimize perceived response time. Increasing the collection interval factor decreases CPU consumption and LAN load, but response time might appear slower because the intervals are longer.
Collection intervals do not affect memory use.
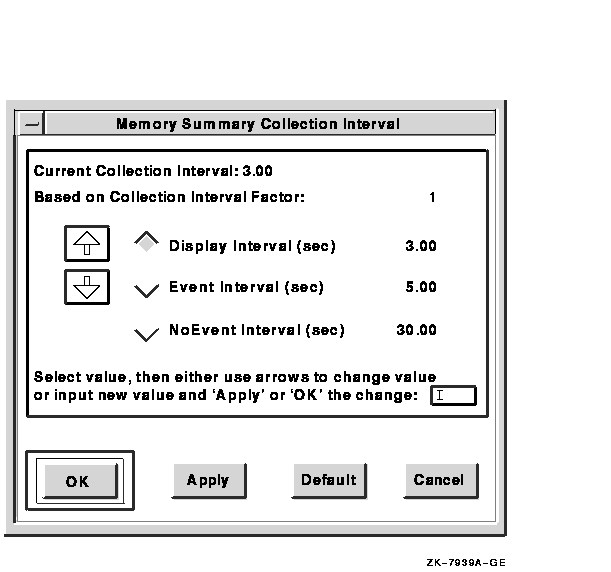
To change a collection interval, choose Collection Interval from the Customize menu. Figure 5-7 shows a sample Memory Summary Collection Interval dialog box.
Figure 5-7 Memory Summary Collection Interval Dialog Box

Table 5-4 describes the fields on the Memory Summary Collection Interval dialog box.
| Current Collection Interval | Displays the number of seconds between requests for data. You can change the value for all collection intervals for all windows by choosing DECamds Customizations from the Customize menu of the Event Log or System Overview window. The DECamds Application Customizations dialog box appears and you can increase or decrease the collection interval factor. |
| Based on Collection Interval Factor | Displays the number with which the collection interval is multiplied. |
| Display Interval (sec) | Displays the collection interval for displaying data in a window. You can change the interval by clicking on the up or down arrows in the dialog box. |
| Event Interval (sec) | Displays the collection interval used when events are found. This value is used by default when you start background collection. You can change the interval by clicking on the up or down arrows in the dialog box. |
| NoEvent Interval (sec) | Displays the collection interval when no events are found. You can change the interval by clicking on the up or down arrows in the dialog box. |
To apply the changes, click on OK or Apply. To save collection interval changes, choose Save Collection Interval Changes from the Customize menu.
To change back to DECamds default values for the window, click on Default. To exit without making any changes, click on Cancel.
Table 5-5 lists the default window collection interval values (in seconds) provided with DECamds for each window type.
| Window | Display1 | Event1 | No Event1 |
|---|---|---|---|
| CPU Modes Summary | 5.0 | 5.0 | 5.0 |
| CPU Summary | 5.0 | 10.0 | 30.0 |
| Disk Status Summary | 30.0 | 15.0 | 60.0 |
| Volume Summary | 15.0 | 15.0 | 120.0 |
| Lock Contention | 10.0 | 20.0 | 60.0 |
| Memory Summary | 5.0 | 10.0 | 30.0 |
| Node Summary | 5.0 | 5.0 | 10.0 |
| Page/Swap File Summary | 30.0 | 30.0 | 2400.0 |
| Process Identification Manager 2 | 60.0 | 60.0 | 240.0 |
| Process I/O Summary | 10.0 | 10.0 | 30.0 |
| Single Lock Summary | 10.0 | 10.0 | 20.0 |
| Single Process Summary | 5.0 | 5.0 | 20.0 |
DECamds is a compute-intensive and LAN traffic-intensive application. At times, routine data collection, display activities, and corrective actions can cause a delay in perceived response time.
This section explains how to optimize perceived response time based on actual measurements of CPU utilization rates (throughput). Performance improvements can be made in the following areas:
| Area | Discussed in... |
|---|---|
| DECamds software | Section 5.5.1 |
| System settings | Section 5.5.2 |
| Hardware configuration | Section 5.5.3 |
Site configurations vary widely, and no rules apply to all situations. However, the information in this section can help you make informed choices about improving your system performance.
The following factors affect perceived response time:
When DECamds starts, it polls the LAN to locate all nodes running the DECamds Data Provider, creates a communications link, and collects data from each Data Provider node on the LAN. (See Section 1.1 for more information about establishing a communications link between nodes.)
The initial polling process creates a short-term high load of CPU and LAN activity. After establishing a communications link with other nodes, DECamds reduces polling frequency, thereby reducing the CPU and LAN load.
The following sections describe system settings that you can change to
improve performance and the ability of DECamds to handle data
collection demands.
5.5.1.1 Setting Process Quotas
To improve the performance of DECamds, you might need to change process quotas. The quotas used extensively by DECamds are ASTLM, TQELM, BIOLM, BYTLM, and WSEXTENT. The values listed in Section A.2 are suggestions for a 50-node cluster.
The following process quotas are recommended:
| Quota | Recommended Value1 |
|---|---|
| ASTLM | 4 times the node count |
| TQELM | 4 times the node count |
| BIOLM | 2 times the node count |
| WSEXTENT | 350 times the node count |
| BYTLM | 1500 times the node count |
Perform the following steps to change process quotas:
The maximum size for data packets is 1500 bytes. When the amount of data is greater than 1500 bytes, DECamds must send multiple requests to complete the data collection request.
Table 5-6 shows the LAN load for various levels of collection intervals and data collection. You can modify a data collection window's collection intervals (as explained in Section 5.4) or reduce the scope of data collection (as explained in Section 5.1.1) to reduce LAN activity.
| Data | Outgoing Packet Size (in bytes) on Alpha Systems | Outgoing Packet Size (in bytes) on VAX Systems | Return Packet Size (in bytes) |
|---|---|---|---|
| Configuration data | 129 | 285 | 88 |
| CPU Modes | 201 | 129 | 48 + (64* no. of processors) |
| CPU Summary | 178 | 171 | 16 per active process |
| Disk Status Summary | 473 | 473 | 56 per disk |
| Fix | 24 | 24 | 12 |
| Hello Message | N/A | N/A | 32 |
| Lock Contention | 240 | 240 | 76 per resource |
| Memory Summary | 275 | 275 | 36 per active process |
| Node Summary | 319 | 241 | 48 + (64 * no. of processors) |
| Page/Swap File | 208 | 208 | 46 per page/swap file |
| Process I/O Summary | 236 | 229 | 32 per active process |
| Single Lock (Waiting) | 272 | 272 | 32 per waiter |
| Single Process Summary | 491 | 471 | 00 |
| Volume Summary | 430 | 430 | 28 per disk |
| Previous | Next | Contents | Index |
![[Go to the documentation home page]](../../images/buttons/bn_site_home.gif)
![[How to order documentation]](../../images/buttons/bn_order_docs.gif)
![[Help on this site]](../../images/buttons/bn_site_help.gif)
![[How to contact us]](../../images/buttons/bn_comments.gif)
|
| privacy and legal statement | ||
| 5929PRO_007.HTML | ||